SIGEO / SMAI: environmental monitoring and delivery
R&D and engineering delivery lead, SIGEO
At SIGEO I led R&D and engineering delivery for TAP/SMAI, an environmental monitoring system supporting the Trans Adriatic Pipeline construction site in Italy. The work combined data integration with coordination of scope and delivery.
Problem: connect environmental measurements to monitoring context
Environmental monitoring needs measurements to be interpreted in the context of the places and activities they describe. The project supported civilian construction monitoring, with engineering scope coordinated across consortium partners.
My contribution included integration of two datasets through a shared field and presenting environmental measurements through graphs. The case describes this verified scope rather than inferring sensor networks or a deployment stack.
Architecture: linked datasets and monitoring views
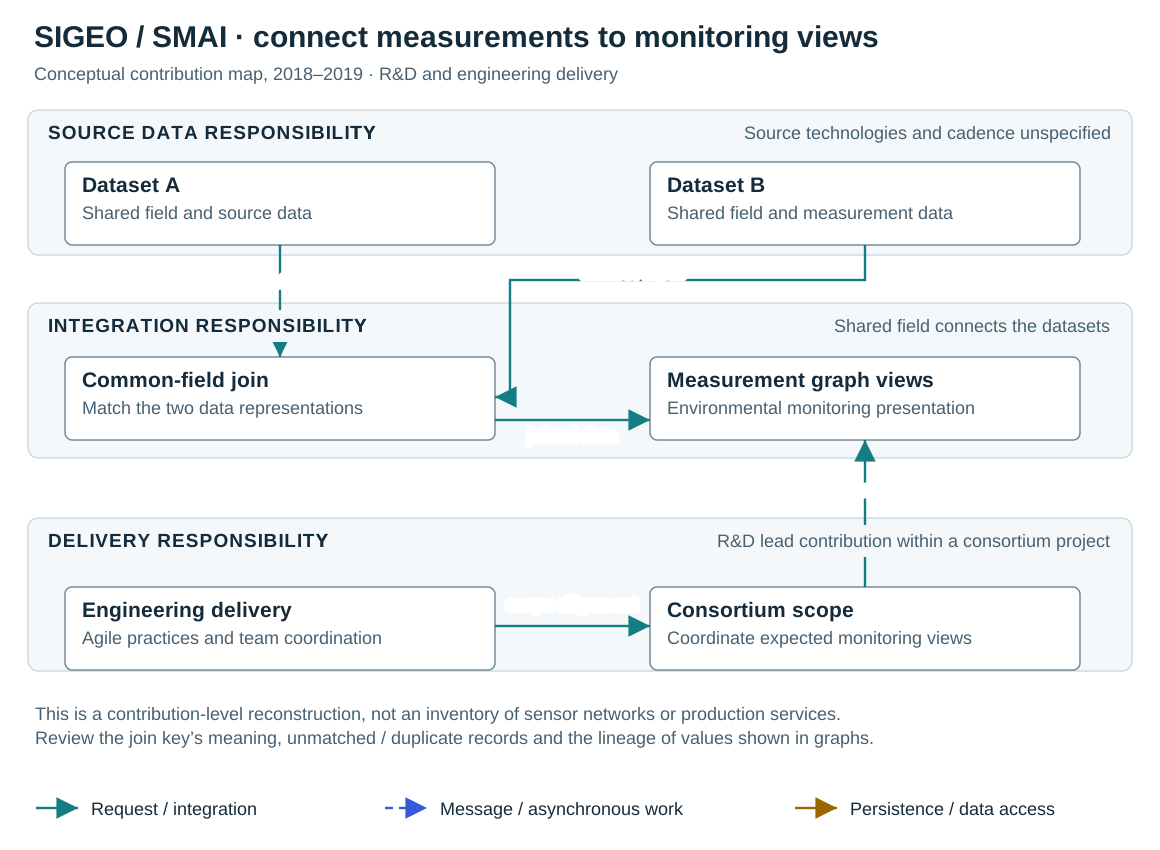
The conceptual overview connects two source datasets through their common field, then exposes environmental measurements in graph views. It shows responsibilities supported by my project account, not an inventory of production services.
Joining datasets is a domain decision as well as a data operation. The shared field needs a stable meaning for the resulting monitoring view to remain interpretable.
Environmental data integration and delivery scope
Two datasets are joined through a common field to support environmental measurement graphs. The separate delivery lane reflects R&D leadership, scope coordination and engineering practices. The view is conceptual; source technologies, collection frequency and production topology are not established here.
Decisions: connect technical work to an agreed scope
As R&D lead, I coordinated engineering delivery, Agile practices and scope with consortium partners. That connects the data-integration work to the practical question of which monitoring views the team needed to deliver.
A retrospective review would compare a validated common-field join with manual matching between reports. Manual work can handle exceptions but is difficult to reproduce consistently. A join still requires explicit checks for missing, duplicated or changing identifiers; those are review criteria, not claimed historical failures.
Outcomes: an environmental monitoring contribution
My professional record establishes the 2018–2019 SIGEO role and TAP/SMAI scope. My contribution combined environmental data integration, graph presentation and engineering delivery coordination.
This case does not claim a quantified environmental impact, regulatory approval, sensor throughput, reduced incident rate or sole authorship of the wider monitoring system.
Learning: a shared identifier needs a shared meaning
A graph can appear convincing even when a join is wrong. A technical review should follow the shared field from each dataset into the resulting view and explain its domain meaning.
The delivery lesson is equally concrete: technical scope, stakeholder expectations and reviewable data views need to be coordinated together. For a new version I would validate unmatched and duplicate keys and graph lineage before expanding the interface.
Questions & discussion
What does the architecture diagram prove?
It maps the verified contribution scope: two datasets, a shared-field join and environmental graph views. It does not establish a specific runtime, sensor network or production topology.
Read the relevant sectionWhat was the leadership contribution?
R&D and engineering delivery leadership, Agile practices and scope coordination with consortium partners during 2018–2019.
Read the relevant sectionWhat would you test in the integration?
Common-field uniqueness and meaning, missing or duplicate matches, source changes and the lineage of values presented in graphs.
Read the relevant sectionSources & scope
- Professional project and contribution account
Confirmed career context: SIGEO, 2018–2019; TAP/SMAI environmental monitoring; Candidate-provided role and implementation scope